
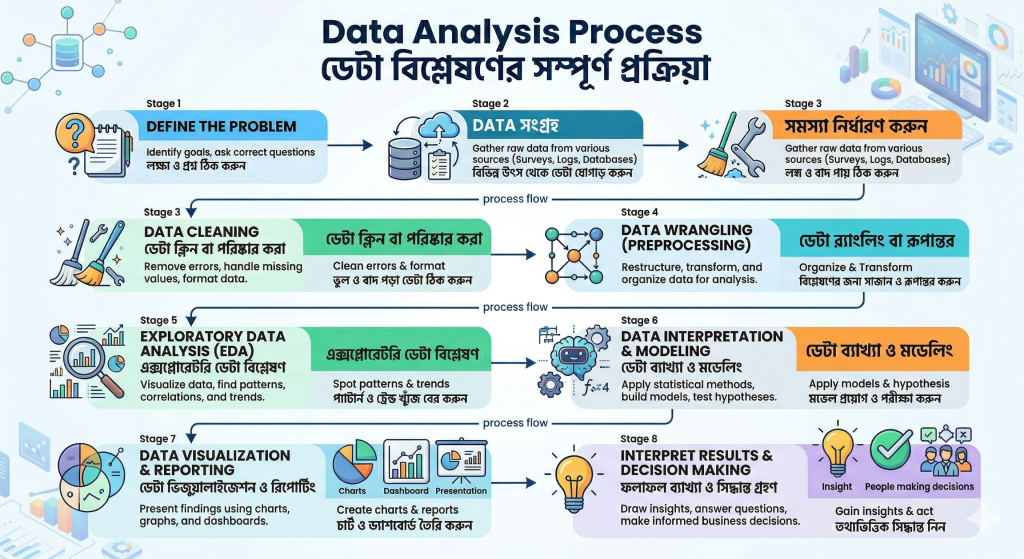
Stage 1: Define the Problem (সমস্যা নির্ধারণ করুন)
The entire process begins not with data, but with a clear understanding of the goal. You must identify what specific question you are trying to answer or what problem you are trying to solve.
- Key Actions:
- Identify the core business goals.
- Formulate precise, answerable questions.
- লক্ষ্য ও প্রশ্ন ঠিক করুন (Fix targets and questions).
- Visual: A question mark and a list signify the inquiry phase.
Stage 2: Data Collection (ডেটা সংগ্রহ)
Once the problem is defined, the next step is to gather the relevant information. This stage involves identifying all potential sources where the necessary data might reside.
- Key Actions:
- Identify diverse data sources.
- Gather raw data from surveys, log files, and databases.
- বিভিন্ন উৎস থেকে ডেটা যোগাড় করুন (Gather data from various sources).
- Visual: Multiple databases and cloud storage representing varied data sources.
Stage 3: Data Cleaning (ডেটা ক্লিন বা পরিষ্কার করা)
Raw data is rarely perfect. It is often messy, inconsistent, and contains errors. This critical stage focuses on fixing those issues to ensure the analysis is accurate.
- Key Actions:
- Remove errors, duplicates, and inaccurate records.
- Handle missing values appropriately (e.g., filling them in or removing those rows).
- Format data types (e.g., ensuring dates are in a date format).
- ভুল ও বাদ পড়া ডেটা ঠিক করুন (Fix errors and missing data).
- Visual: Cleaning tools (mop and wrench) tidying up cluttered data points.
Stage 4: Data Wrangling (Preprocessing) (ডেটা র্যাংলিং বা রূপান্তর)
While cleaning is about fixing data, wrangling is about restructuring it. The goal is to prepare the cleaned data into a format that is optimized for analysis.
- Key Actions:
- Restructure and reshape data tables.
- Transform variables (e.g., combining first and last names, creating new calculated fields).
- Organize the data into a structured schema ready for analysis tools.
- বিশ্লেষণের জন্য সাজান ও রূপান্তর করুন (Arrange and transform for analysis).
- Visual: Nodes transforming into an organized structure.
Stage 5: Exploratory Data Analysis (EDA) (এক্সপ্লোরেটরি ডেটা বিশ্লেষণ)
This is the “getting to know your data” stage. Analysts use visualizations and summary statistics to understand the data’s distributions, find patterns, and identify interesting correlations before building models.
- Key Actions:
- Visualize data using initial charts (histograms, scatter plots).
- Calculate summary statistics (means, medians).
- Discover hidden patterns, trends, and correlations.
- প্যাটার্ন ও ট্রেন্ড খুঁজে বের করুন (Spot patterns and trends).
- Visual: A magnifying glass over charts, symbolizing discovery.
Stage 6: Data Interpretation & Modeling (ডেটা ব্যাখ্যা ও মডেলিং)
In this advanced analysis stage, you apply formal statistical methods and machine learning algorithms to test hypotheses, make predictions, and find definitive answers to the defined problem.
- Key Actions:
- Apply statistical methods.
- Build predictive or descriptive models.
- Test hypotheses (confirming or disproving theories).
- মডেল প্রয়োগ ও পরীক্ষা করুন (Apply models and test them).
- Visual: A brain and gears with algorithms, showing computation and modeling.
Stage 7: Data Visualization & Reporting (ডেটা ভিজ্যুয়ালাইজেশন ও রিপোর্টিং)
After analyzing the data, you must communicate your findings effectively. Complex numbers and statistics are translated into easy-to-understand visual summaries for stakeholders.
- Key Actions:
- Present findings using clear, impactful charts and graphs.
- Create interactive dashboards for dynamic data exploration.
- Develop comprehensive reports summarizing key takeaways.
- চার্ট ও ড্যাশবোর্ড তৈরি করুন (Create charts and dashboards).
- Visual: Pie charts, line graphs, and presentation boards.
Stage 8: Interpret Results & Decision Making (ফলাফল ব্যাখ্যা ও সিদ্ধান্ত গ্রহণ)
The final and most important stage. The analysis is used to derive concrete business insights. This leads to informed, data-driven decisions that solve the original problem.
- Key Actions:
- Draw meaningful business insights from the visualizations and model outputs.
- Provide definitive answers to the problem questions.
- Empower leaders to make informed business decisions.
- তথ্যভিত্তিক সিদ্ধান্ত নিন (Take information-based decisions).
- Visual: A lightbulb (insight), a checkmark, and a team making a final decision.