Take your Excel reports from static to spectacular! In this video, I’m building a fully interactive Excel Dashboard using Pivot Charts and Slicers. Impress your boss and make your data tell a dynamic story.
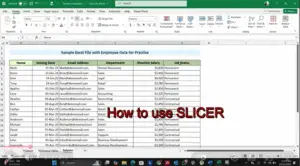
We’ll move beyond basic charts and connect Pivot Charts to a multiple set of slicers, creating a cohesive and powerful analytical tool.

